

Lead the shift before it stalls your strategy.
Six diagnostics, one system: three organizational diagnostics for direction, fit and readiness, one for a change in flight, and two for the individual. Find the one that fits the shift in front of you.
Change is the event. Shift is the work.
Have a session or access code? Go to the diagnostics site →
Start with what you’re seeing.
Pick the situation that sounds most like yours. Each diagnostic answers one question well, rather than a general survey that scores everything and settles nothing, so what you run matches the problem you actually have. Not sure? That’s what the discovery call is for.
Direction, fit and readiness.
Three facilitated organizational diagnostics that run inside an IPL engagement, from the strategy your leaders are aiming at to whether the organization is set up to execute it.
Where is our organization really headed, and does the top team agree?
Best when a strategy shift is coming and leadership team alignment has to be settled before you measure anything against it.
- Who takes it
- The 8–15 leaders who set direction
- Format
- Eight questions, then agreement is measured. Facilitated as an online poll or interviews.
- Who sees results
- The facilitator only. Respondents choose their own two-word code name.
- Pairs with
- Strategy-Fit. Shift Compass sets the target; Strategy-Fit tests the fit.
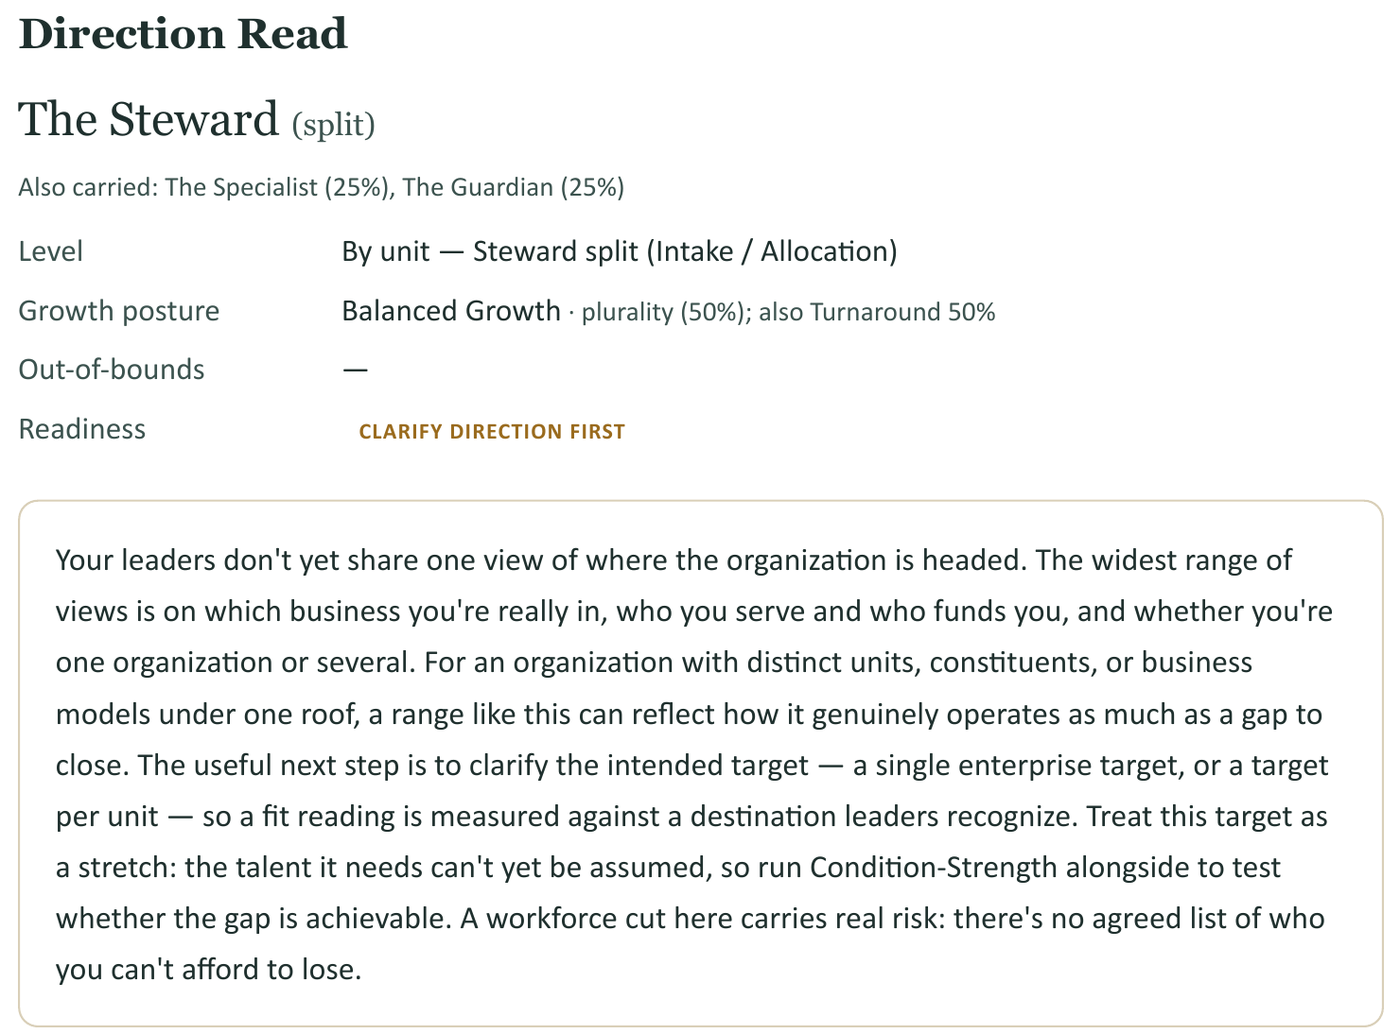
What you get: the operating identity your strategy points to, its growth posture, anything ruled out by charter or mandate, and how aligned your leaders really are. If they don’t agree on the basics, it says so: settle direction first.
How do we actually operate today, and does that fit what our strategy needs?
Best when the strategy is clear, but the organization’s design and habits may be pulling against it.
- Who takes it
- A cross-section of the organization, across levels and business areas
- Format
- 24 paired statements, facilitated, with results updating live for the facilitator
- Who sees results
- Pooled responses, never attributed. A role level is shown only with 5 or more people.
- Pairs with
- Shift Compass, which sets the target this measures against
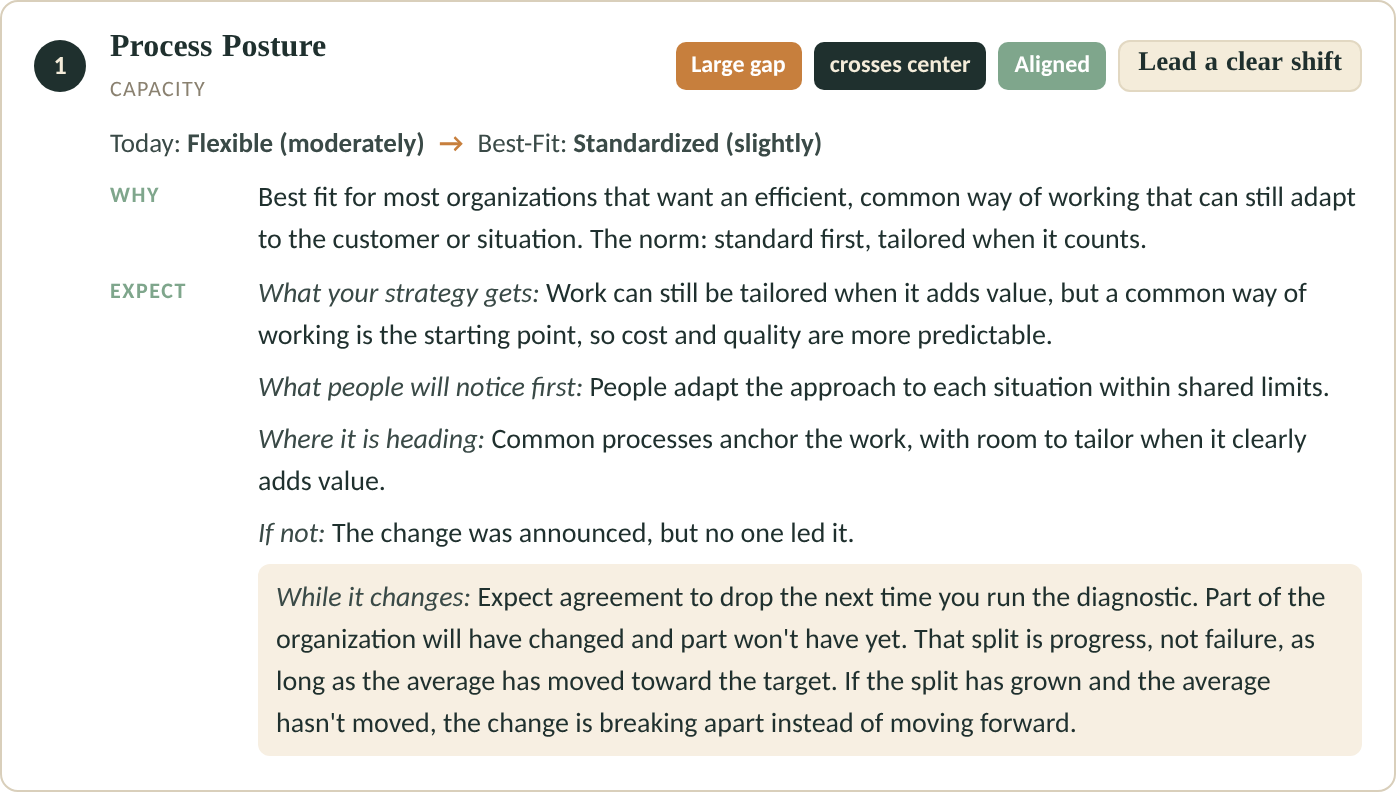
What you get: where you operate today on 24 choices, against where your strategy needs you, and how far people agree. Then a short Prioritized Shift Agenda: no more than three moves, ranked by how much each matters to your strategy, not by how big the gap looks. Each one says why it matters and what people will notice if it works.
See what the report contains
The Prioritized Shift Agenda. Up to three moves, each with why it matters, what your strategy gets, what people will notice first, and what it means if they don’t. Plus what to protect, and what looks on-fit but isn’t settled.
Where you are vs. where the strategy needs you. Each of the six conditions in plain language: what the strategy needs, how you operate today, and where the shift is.
The Fit × Alignment Map. All 24 dimensions on one page, each with its recommended move, from “sustain and build on” to “align first, then shift.”
Where leaders and staff see different organizations. Each role level’s view on all 24 dimensions, against the best-fit target.
Delivered as a client-ready report and a live facilitator dashboard. The agenda sets a date to run it again and names what to check.
How strongly, and how consistently, are the conditions in place for our strategy to succeed — and which few moves matter most?
Best when the plan is sound but execution keeps stalling, and you need to know which condition is missing.
- Who takes it
- A broad cross-section, spread by business area and by level
- Format
- 36 statements, plus three optional open questions. Facilitated.
- Who sees results
- No names, always pooled. Nothing is reported on fewer than 5 responses — per item, not per survey.
- Pairs with
- Shift-Maker Profile: capable people inside weak conditions is capability you’re wasting
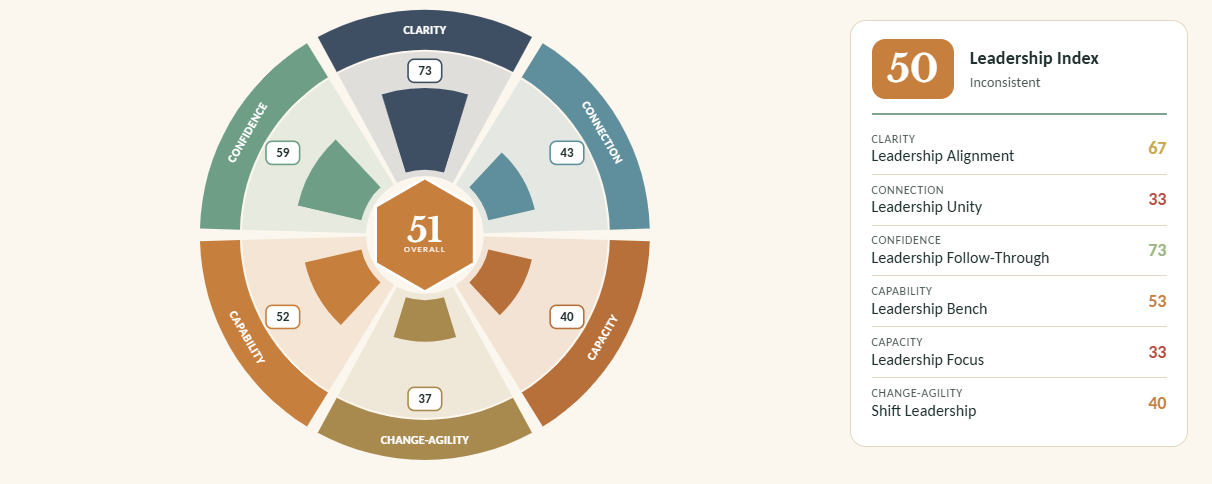
What you get: an Index from 0 to 100 on each of the six conditions — Clarity, Connection, Confidence, Capability, Capacity, Change-Agility — and on all 36 facets beneath them, read against targets you set. 60 is the line: below it, a condition holds the organization back; from 70, it holds on its own.
Then a second read on every facet: how widely that view is shared. Two facets can both score 40 and point to different problems — one tells you where to look, the other what to build.
And a short, sequenced list of where to start, plus what not to start yet, and why — with what you should expect to change if each move works.
See what the report contains
Every facet placed. All 36 facets on a strength-by-alignment grid, with the move named for each cell — from “protect and build on” to “build the baseline.”
A Leadership Index. One leadership facet inside every condition, read together as a single score — including the gap between how senior leaders rate themselves and how everyone else rates them.
What to expect. Every move names the observable change it should produce, and what a non-result would mean. Not a predicted score — there is no normative database behind one, and a number we miss is worse than no number at all.
What to protect. The conditions that are working, and the specific way each one is lost. Sometimes the highest-value move of the year is keeping something from slipping, and a gap ranking will never say so.
In people’s own words. Three optional open questions: what to protect, what gets in the way, and the one thing you would change. Shown unedited, behind the privacy floor.
Delivered as a client-ready group report, a facilitator edition with the reading behind each score, and a live dashboard. Built to be run again in six to twelve months, so you can watch the gap close.
How is this change landing?
A read on one named change — how it is landing across everyone it affects, debriefed in the room.
Where are we in leading this specific change, and where does leadership attention need to go next?
Best when one named change is underway (a restructure, a system rollout, an integration) and you need to see how it’s landing across people.
- Who takes it
- Everyone affected by the change
- Format
- 18 questions, built for a live workshop debrief
- Who sees results
- Code names, never real names. Role-level breakouts need 5 or more per level.
- Pairs with
- My Shift Atlas: one change across the organization, all changes for each person
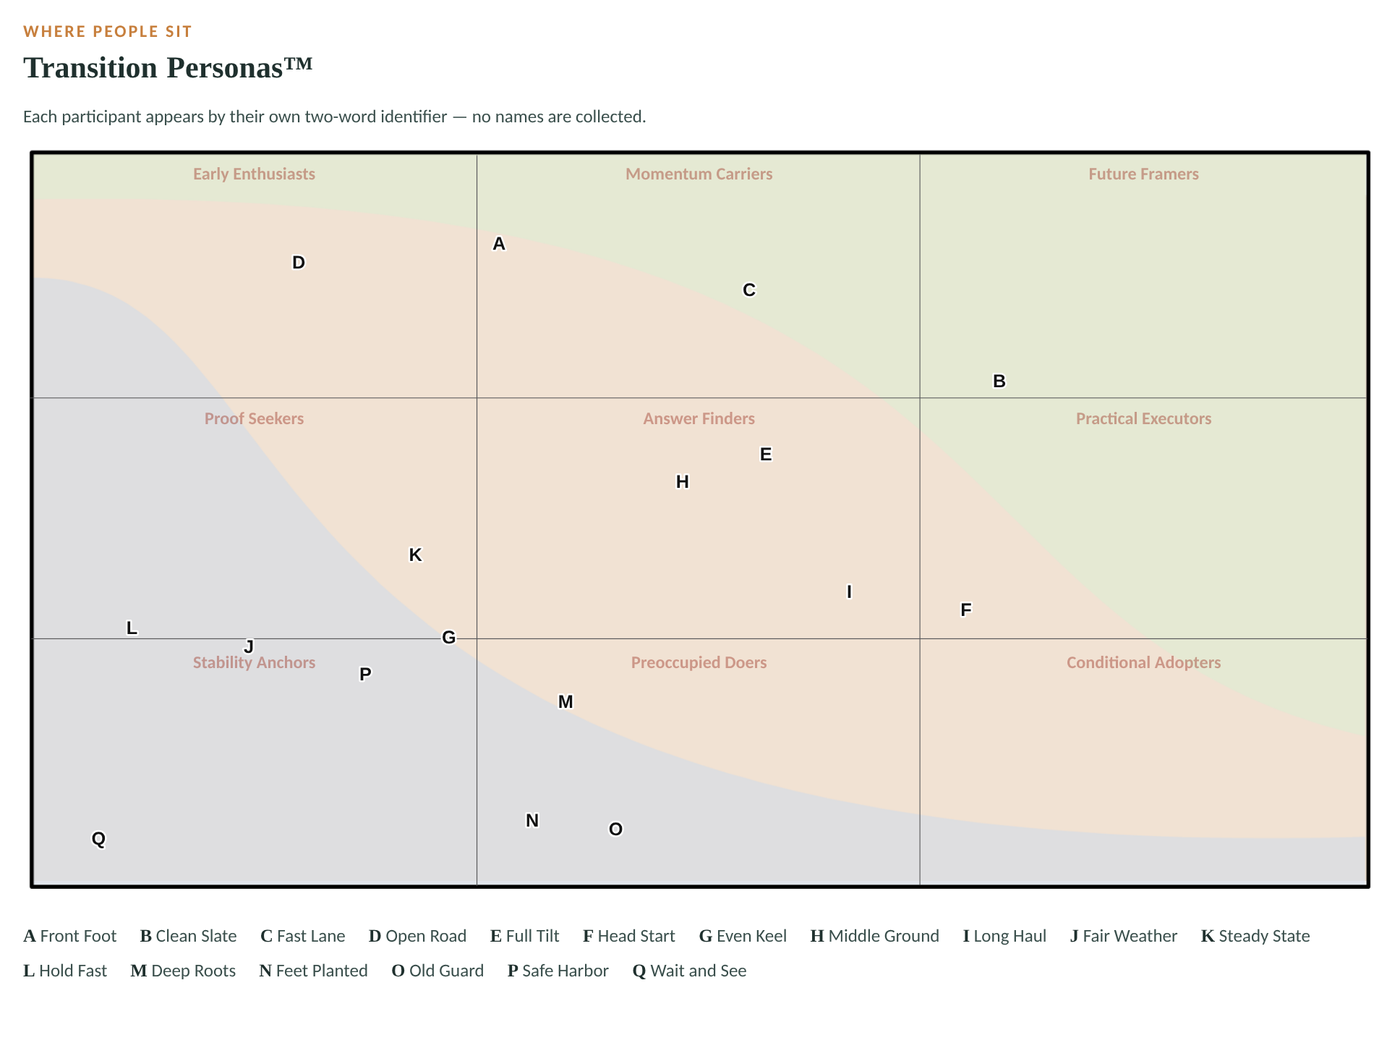
What you get: each participant’s place on the Transition Personas™ map (nine personas, none of them wrong), whether the conditions for this change exist, whether people feel them, and where they exist but aren’t landing. Includes a facilitator guide for the group conversation.
The person inside the change.
One shows how someone is navigating every shift at once. The other shows how colleagues experience them making change happen.
How am I navigating every change at once, and what one move would change the most?
Best when your people are working through several changes at once and you need to help without asking anyone to expose themselves.
- Who takes it
- Each person, for themselves
- Format
- Self-serve, with a check-in whenever a person’s changes move.
- Who sees results
- Only the person. Your organization sees patterns across groups of 8 or more, never a name, an answer or a map.
- How it’s licensed
- Annual seats (25-seat minimum). Organizations with 100 or more seats can add a Cohort Report.
What you get: a personal map of every shift, where each one has you, which layer is loudest, and one next move. Four changes at once is not one change, four times.
Five shifts on one map. Each dot is where a shift has the person; each arrow, which way it’s pulling.
Who makes change happen, not just navigates it, and what is each person’s next step?
Best when you’re developing leaders or high-potentials and want to know who is driving change, and how to grow that.
- Who gives feedback
- Self, manager, peers and cross-team colleagues, and (optionally) direct reports
- Format
- Six areas, each rated with a line of evidence. A coaching debrief is strongly recommended.
- Who sees results
- The person assessed, who decides whether their manager sees it. No names are collected, and peer input is pooled.
- Minimum raters
- Self, manager and 3 peers before any result is produced
What you get: a Shift-Making Score, the gap between how you see yourself and how others see you, what your mix of strengths lets you do and what it limits, and one area to develop with the next behavior already written. A development tool, not a review or a ranking.
capabilities where this person makes change happen, as rated by self, manager, peers and direct reports
New · Free
Start with yourself.
Pick the change that matters most for you to get right, and see how you’re showing up in it.
All six diagnostics at a glance.
What each diagnostic measures, who answers it, and who sees what comes back.
| Diagnostic | Level | Who takes it | Format | Who sees what |
|---|---|---|---|---|
| Shift Compass | Organization | 8–15 leaders who set direction | Facilitated | Facilitator only |
| Strategy-Fit | Organization | Cross-section, all levels | Facilitated | Pooled; role levels at 5+ |
| Condition-Strength | Organization | Broad cross-section | Facilitated | No names; 5+ per item |
| Our Shift Journey | A live change | Everyone affected | Facilitated, workshop debrief | Code names; role levels at 5+ |
| My Shift Atlas | Individual | Each person | Self-serve | Private; groups at 8+ |
| Shift-Maker Profile | Individual | Self, manager, peers, reports | Facilitated, coaching debrief | No names; peers at 3+ |
Three steps, low risk.
Not a broad organizational effectiveness study. A focused read, then the moves it points to.
Choose a starting point
Not sure which diagnostic fits? That’s the discovery call. We start where your shift is actually stuck: direction, readiness, a live change, or your people’s load.
Run it
Facilitated with IPL, or self-serve for My Shift Atlas. Every survey is written in plain language, with no jargon to decode.
Get the results, and the moves
A clear diagnosis, then the specific moves most likely to help. Every diagnostic is built to be run again as the shift moves, so you can see what changed.
One discipline runs through all of it: DETECT → UNLOCK → CHOOSE → ACT → LEARN
Before you reach out.
Facilitated or self-serve: which is which?
Who sees the results?
What do respondents actually see?
Can we run more than one?
We’ve used Prosci or Kotter. How is this different?
Bring us the friction you’re sensing.
A 30-minute discovery call, no prep needed. Tell us about the shift you’re navigating, and we’ll suggest which diagnostic would tell you the most.
Book a discovery call
A 30-minute conversation about the shift you’re navigating.